A look at American unemployment rates by state, 2000-2009
A look at American unemployment rates by state from 2000-2009 reveals a decade of steady unemployment rates that ended with a sharp rise in unemployment. As with most financial crises, the recession of the decade greatly affected unemployment rates.
The unemployment rate is the number of people that have been determined as being without employment and who have actively tried to find employment within the last four weeks. It does not include people who are jobless and have stopped looking or who did not look within that four-week period.
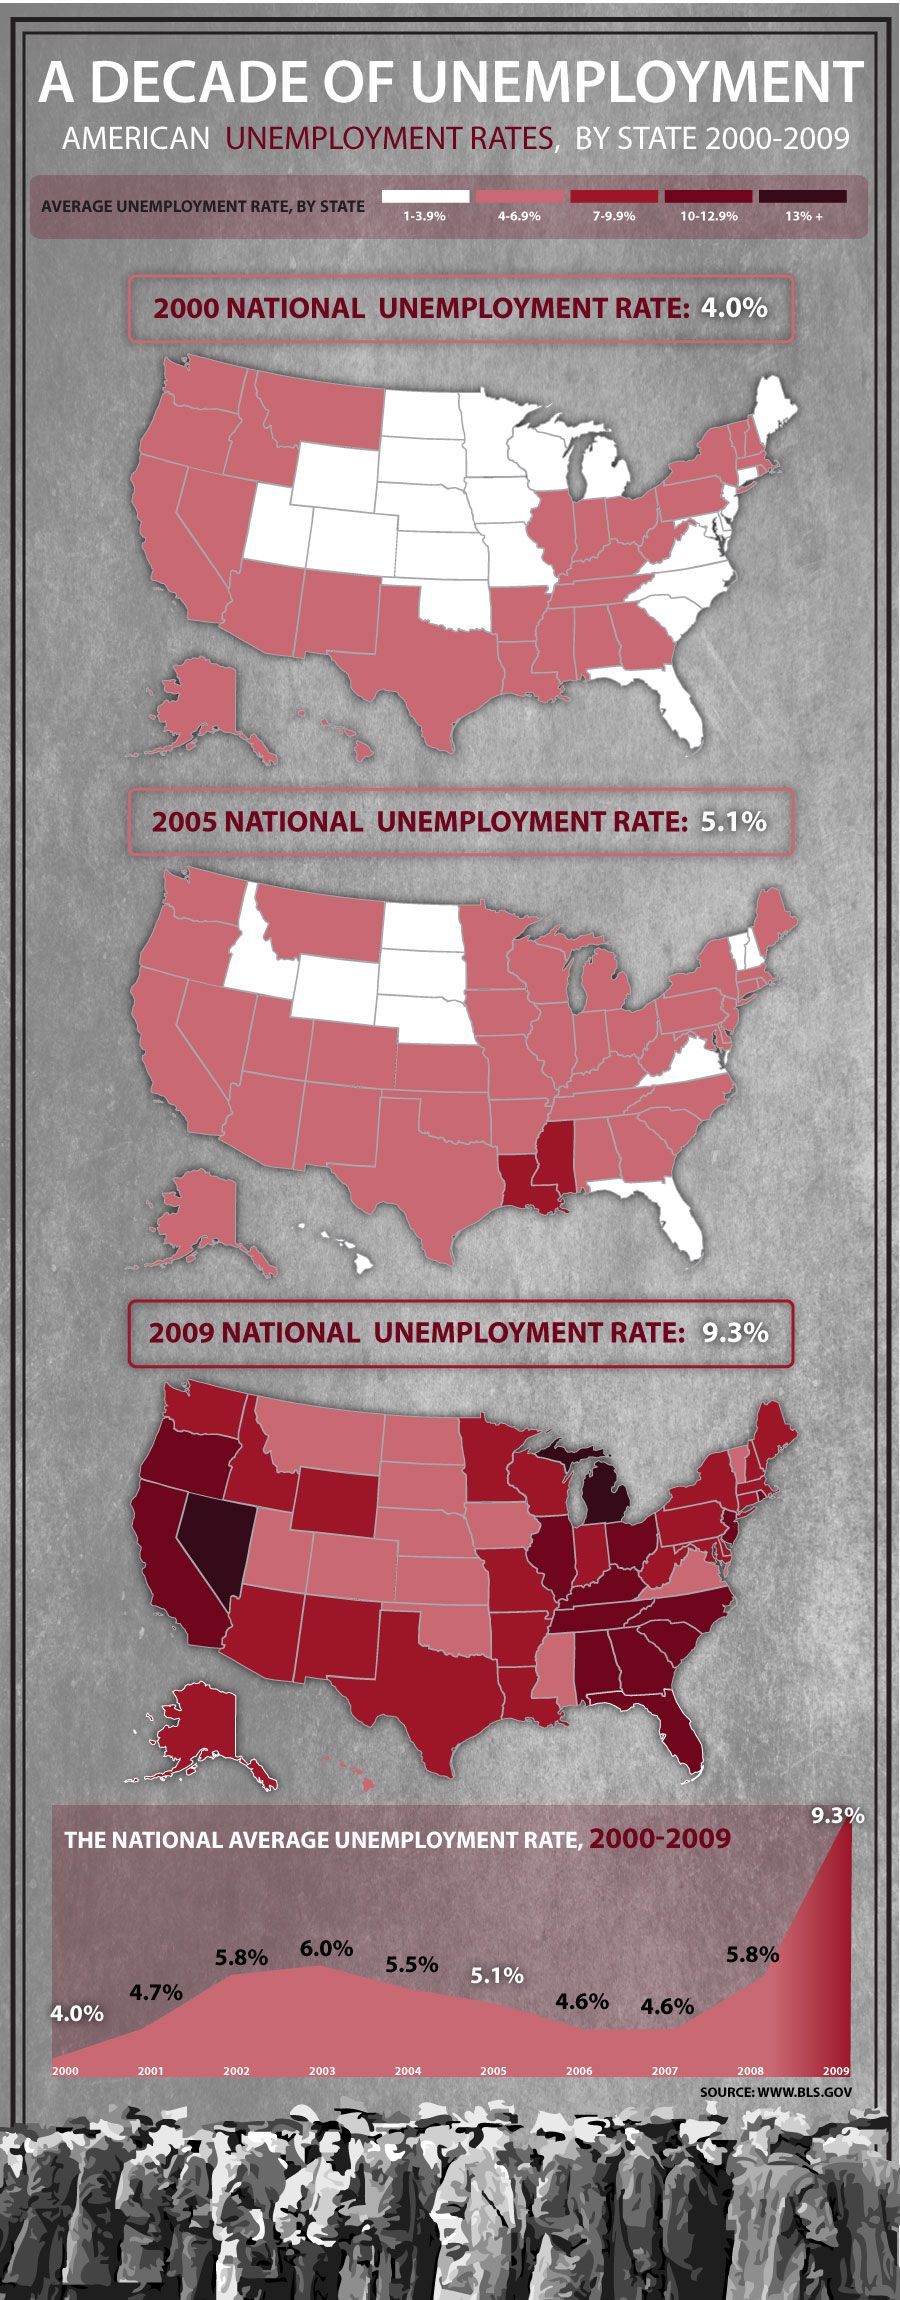
In 2000, the national unemployment rate was 4.0 percent. Twenty-two states had unemployment rates of between 1 percent and 3.9 percent. Twenty-eight states had unemployment rates between 4 percent and 6.9 percent.
In 2005, the national unemployment rate was 5.1 percent. Ten states had unemployment rates of between 1 percent and 3.9 percent. Thirty-eight states had unemployment rates of between 4 percent and 6.9 percent. Two states had unemployment rates between 7 percent and 9.9 percent.
In 2009, the national unemployment rate was 9.3 percent. Zero states had unemployment rates of between 1 percent and 3.9 percent. Thirteen states had unemployment rates of between 4 percent and 6.9 percent. Twenty-two states had unemployment rates between 7 percent and 9.9 percent. Thirteen states had unemployment rates between 10 percent and 12.9 percent. Three states had unemployment rates of 13 percent and higher.
The National Average Unemployment Rate
The national average unemployment rate from 2000 to 2009 stayed relatively steady until it changed sharply when the economic recession began in late 2007. Until that time, the national unemployment rate had varied by less than 2 percent throughout the decade.
- In 2000, the national average unemployment rate was 4 percent.
- In 2001, the national average unemployment rate was 4.7 percent.
- In 2002, the national average unemployment rate was 5.8 percent.
- In 2003, the national average unemployment rate was 6 percent.
- In 2004, the national average unemployment rate was 5.5 percent.
- In 2005, the national average unemployment rate was 5.1 percent.
- In 2006, the national average unemployment rate was 4.6 percent.
- In 2007, the national average unemployment rate was 4.6 percent.
- In 2008, the national average unemployment rate was 5.8 percent.
- In 2009, the national average unemployment rate was 9.3 percent.
Employment Change by Industry
Mass layoff figures from sectors such as healthcare, education, finance and much more.
 (Click to Enlarge)
Employment Change by Industry
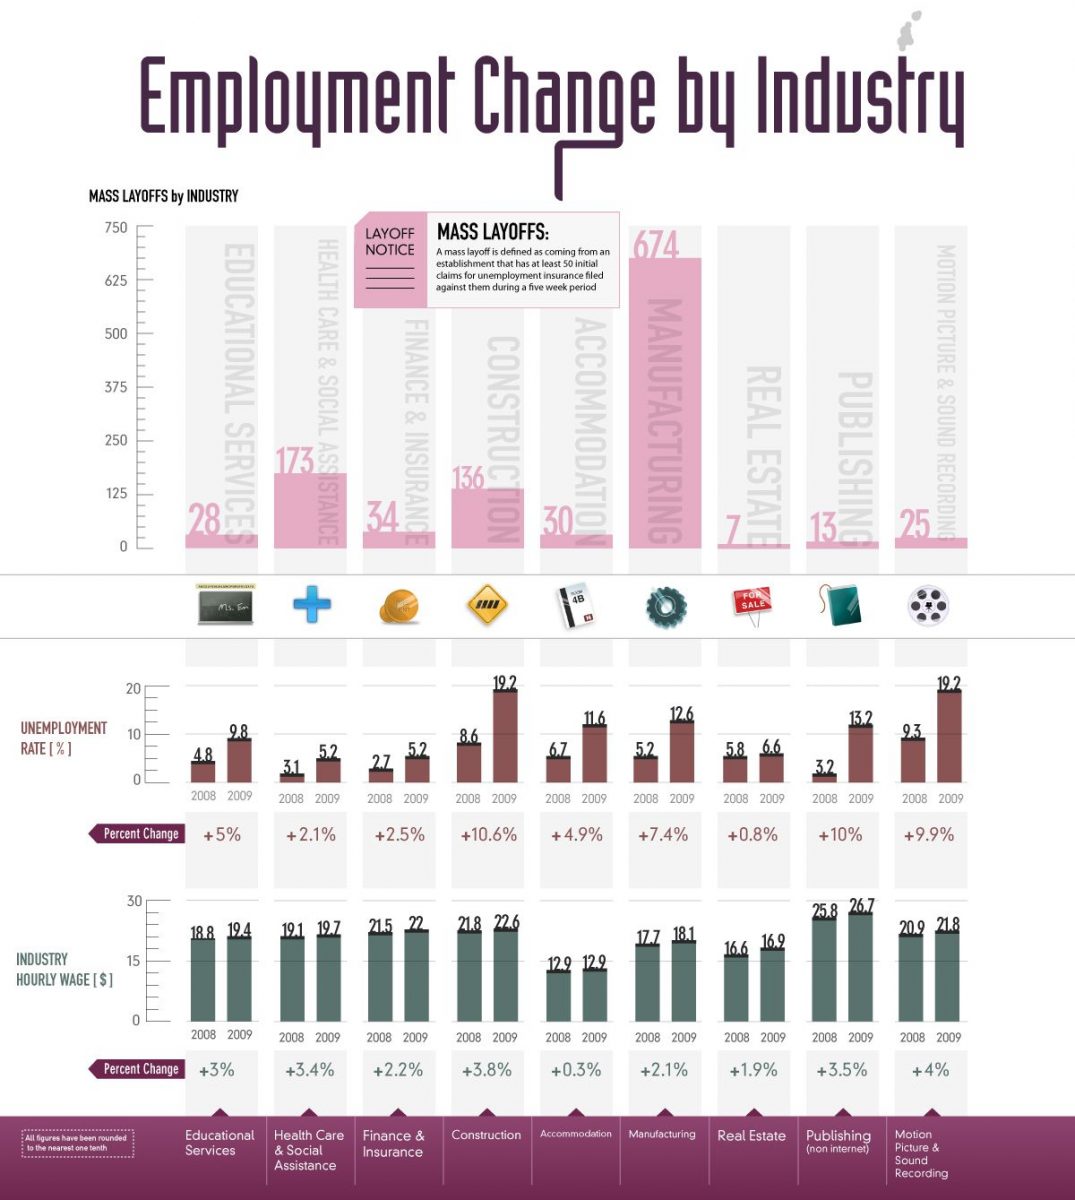
A mass layoff is defined as coming from an establishment that has at least 50 initial claims for unemployment insurance filed against them during a five-week period.
In educational services, there have been 28 mass layoffs. In health care and social assistance, there have been 173 mass layoffs. In finance and insurance, there have been 34 mass layoffs. In construction, there have been 136 mass layoffs. In accommodation, there have been 30 mass layoffs. In manufacturing, there have been 674 mass layoffs. In real estate, there have been seven mass layoffs. In publishing, there have been 13 mass layoffs. In motion picture and sound recording, there have been 25 mass layoffs.
In 2008, the unemployment rate in the educational services industry was 4.8 percent. In 2009, the unemployment rate was 9.8 percent, a change of 5 percent. In 2008, the unemployment rate in the health care and social assistance industry was 3.1 percent. In 2009, the unemployment rate in the industry was 5.2 percent, a change of 2.1 percent. In 2008, the unemployment rate in the finance and insurance industry was 2.7 percent. In 2009, the unemployment rate was 5.2 percent, a difference of 2.5 percent. In 2008, the unemployment rate in the construction industry was 8.6 percent. In 2009, the unemployment rate was 19.2 percent, a change of 10.6 percent. In 2008, the unemployment rate in the accommodation industry was 6.7 percent. In 2009, the unemployment rate was 11.6 percent, a change of 4.9 percent.
In 2008, the unemployment rate in the manufacturing industry was 5.2 percent. In 2009, the unemployment rate was 12.6 percent, a change of 7.4 percent. In 2008, the unemployment rate in the real estate industry was 5.8 percent. In 2009, the unemployment rate was 6.6 percent, a change of 0.8 percent. In 2008, the unemployment rate in the publishing industry was 3.2 percent. In 2009, the unemployment rate was 13.2 percent, a change of 10 percent. In 2008, the unemployment rate in the motion picture and sound recording industry was 9.3 percent. In 2009, the unemployment rate was 19.2 percent, a change of 9.9 percent.
In 2008, the hourly wage in the educational services industry was $18.80. In 2009, the hourly wage in the industry was $19.40, a change of 3 percent. In 2008, the hourly wage in the health care and social assistance industry was $19.10. In 2009, the hourly wage in the industry was $19.70, a change of 3.4 percent. In 2008, the hourly wage in the finance and insurance industry was $21.50. In 2009, the hourly wage in the industry was $22, a change of 2.2 percent. In 2008, the hourly wage in the construction industry was $21.80. In 2009, the hourly wage in the industry was $22.60, a change of 3.8 percent. In 2008, the hourly wage in the accommodation industry was $12.90. In 2009, the hourly wage in the industry was $12.90, a change of 0.3 percent.
In 2008, the hourly wage in the manufacturing industry was $17.70. In 2009, the hourly wage in the industry was $18.10, a change of 2.1 percent. In 2008, the hourly wage in the real estate industry was $16.60. In 2009, the hourly wage in the industry was $16.90, with a change of 0.3 percent. In 2008, the hourly wage in the publishing industry was $25.80. In 2009, the hourly wage in the industry was $26.70, a change of 3.5 percent. In 2008, the hourly wage in the motion picture and sound recording industry was $20.90. In 2009, the hourly wage in the industry was $21.80, a change of 4 percent.
The Truth Behind America's Unemployment

Unemployment In America
Unemployment in America remains a problem despite the fact that the official unemployment rates are decreasing. According to Fox News, underlying challenges, such as world trade issues, banking issues, and other macroeconomic issues will continue to plague the job market for years to come.
For recently unemployed individuals, the first few days or weeks may provide a relief from the stress of work, however, according to the American Psychological Association,extended periods of unemployment contribute to major amounts of stress, especially as the time of unemployment drags on.
Unemployment Statistics
The current unemployment rate in the United States is 7.6%, meaning an estimated 11.8 million people are without full-time jobs. The southwest and southeast corners of the country remain the hardest hit, though the biggest changes in unemployment rates over the last few years occurred in some of the northern central states and in the south.
Considering America’s financial history, a 7.6% rate of unemployment is not that problematic. The highest unemployment rate topped-off at 23.6% in 1932 and remained 21.7% in 1934 before going down. Through the 1940’s and 50’s, unemployment remained quite low. However, during the early 1980’s, job loss accelerated, reaching 9.7% in 1982. By 1988 the United States economy growing and unemployment was down to 5.5%.
Year 2000 not only witnesses a roaring stock market, but have the lowest unemployment rate in decades, at4.0%. Unsustainable growth, stock market over-valuations, and several financial crises later, unemployment peaked at 9.8% in November 2010.
Reasons for Unemployment
8 million people in the United States lost their jobs or completed a temporary job, resulting in their unemployment.
Over the course of several years, that more than 56.4% who experienced unemployment.
Just look at the following numbers:
- 3,644,000 are re-entrants into the job market.
- 10.1%, or 1,411,000 unemployed people, are new entrants.
- 7.5%, or 973,000, left their jobs on their own.
Duration of Unemployment
Many people, 43.1% or so, have been unemployed for 27 weeks or more.
24.1% have been unemployed between 5 and 14 weeks, while 18.8% spent about a month or less unemployed.
14% endured joblessness for between 15 and 26 weeks.
Persons at Work Part-Time
About 18% of the workforce in the United States is employed part-time.
Of the 25,139,000 part-time workers, 8,604,000 of them are part-time for economic reasons while 5,593,000 cite slack work conditions and 2,579,000 are unable to find full-time work.
Persons with Multiple Jobs
Underemployment has resulted in many people taking more than one job. Most of the 4.7% of employed people with multiple jobs have one full-time and one part-time job. Of the 6,649,000 multiple jobholders in the US, and 3,599,000 of them work this way.
1,061,000 people say their hours vary on one or both of their jobs.
A small portion of people with multiple jobs (241,000) have multiple full-time jobs.
Employment by Selected Industry
The industry with the greatest over-the-month growth was Education and Health Services, with 32.7 hours worked weekly on average and $772.37 earned each week.
Information faced the most losses, though on average they work more and earn more–36.4 hours a week, $1,147.33 earned each week.
Employment by Educational Attainment
College educated candidates with bachelor’s degree or higher have the highest employment, with 44,648,000 working full time. This group also has the lowest rate of unemployment, at 4.6%.
The highest numbers of unemployment remain those without high school diplomas, followed by high school graduates with no college degrees.
Those with less than a diploma also make up the smallest amount of the employed population, at just over 10 million.
Employment by Veteran Status
7.7% of veterans over 18 are unemployed, meaning 877,000 have no jobs, compared to 10,497,000 who do.
Gulf War Era II veterans are suffering the highest rate of unemployment among veterans, at 9.8% or 192,000 unemployed. That’s compared to 1,759,000 who are employed.
Veterans of WWII, the Korean War or Vietnam have the highest rate of employment, at 3,094,000 employed. Just 6.9% or 258,000 of these vets are unemployed.
Employment by Gender and Nativity
Foreign-born women ages 16 and older suffer the highest rate of unemployment, at 9.6%, while foreign-born men ages 16 and older have the lowest rate of unemployment at 7.8%. This is lower than any category of native-born men and women.
Of course, it’s vital to note that the foreign-born workforce is comprised of just over 2 million individuals, while the native-born workers are nearly 12 million.
Wrapping Up
If you’re unemployed or facing unemployment you’re not alone.
Arm yourself with these stats, keep your chin up and take the workforce by storm!


